
This is a first post to show a simple analysis of some open source projects from Spanish public administration as an example of government transparency.
It follows a previous post about transparency in government funded software development. I’ve read about the Technology Transfer Centre from Spanish Ministry of Finance and Public Function, so I decided to run a similar analysis on its repositories in GitHub.
I’ve found very interesting patterns. Let’s name a few.
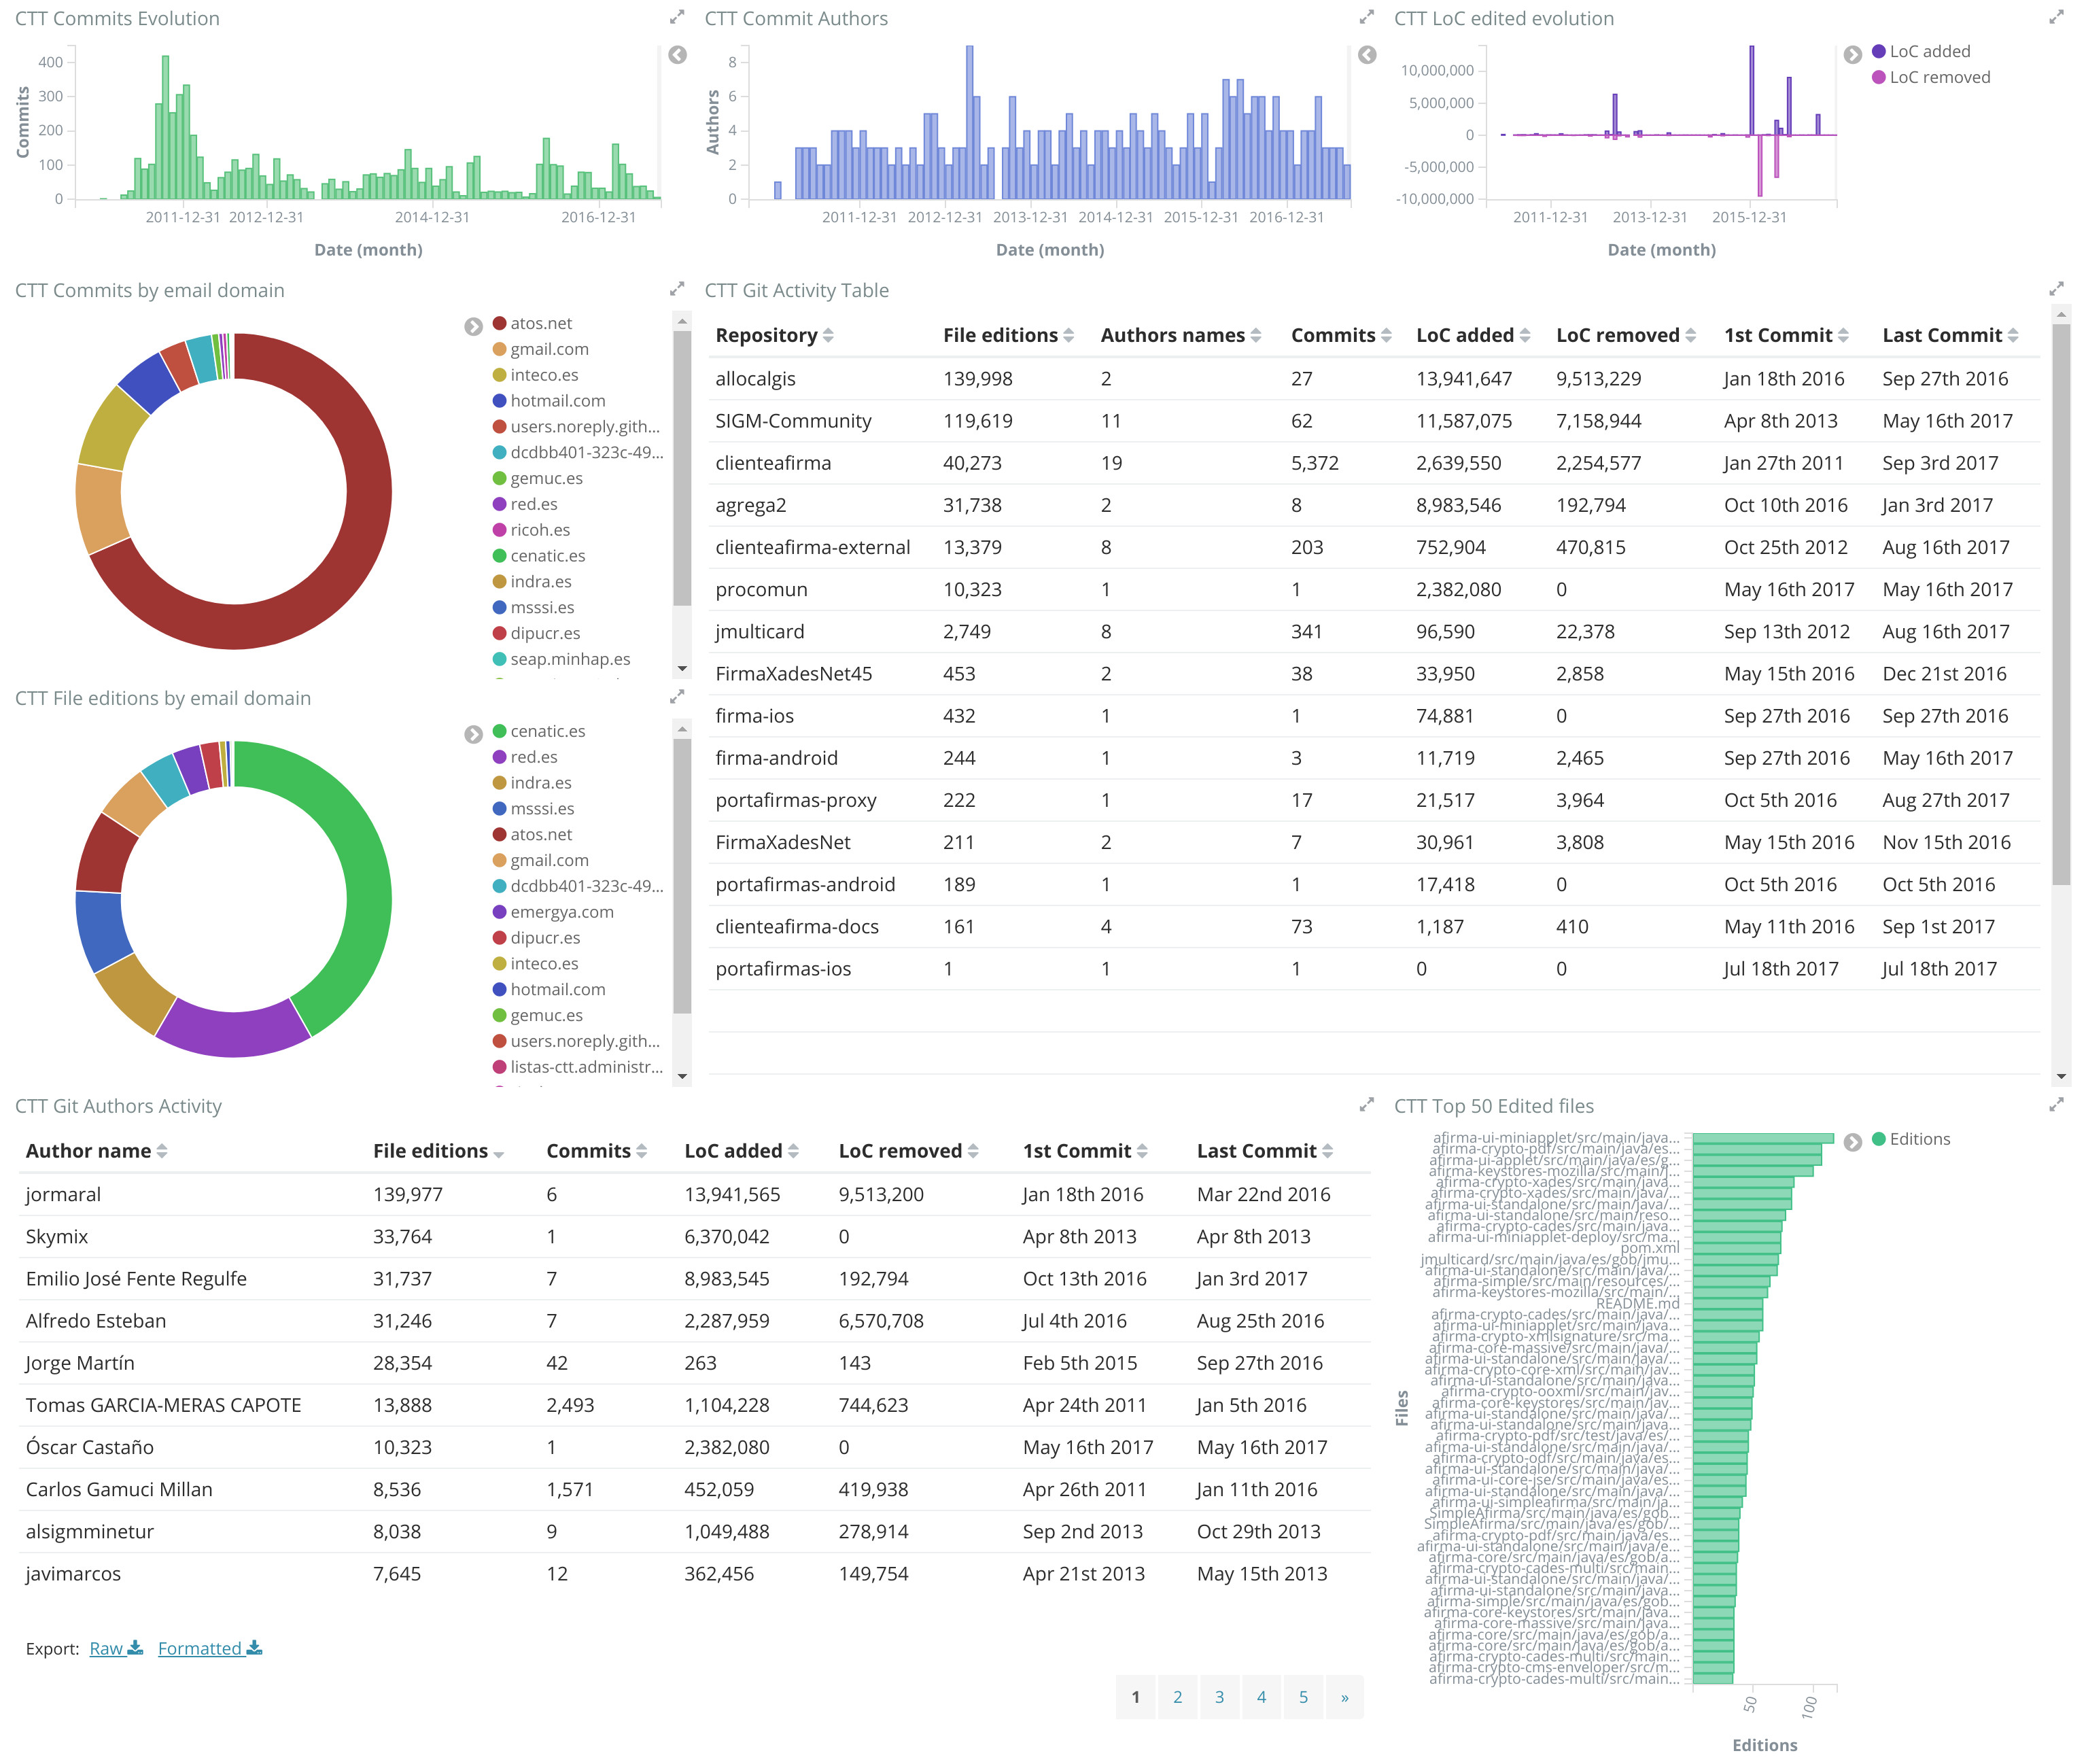
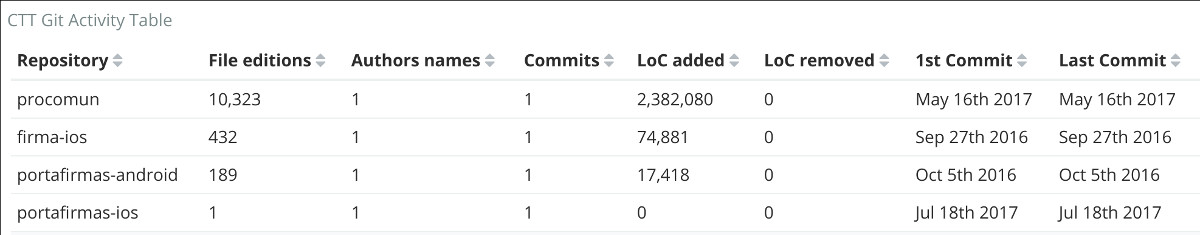
The first thing you might see with a simple analysis is that some projects are not an active project but just code release. If you check projects like procomun, firma-ios, portafirmas-android and portafirmas-ios they have just one commit from one year ago, without any activity after that.
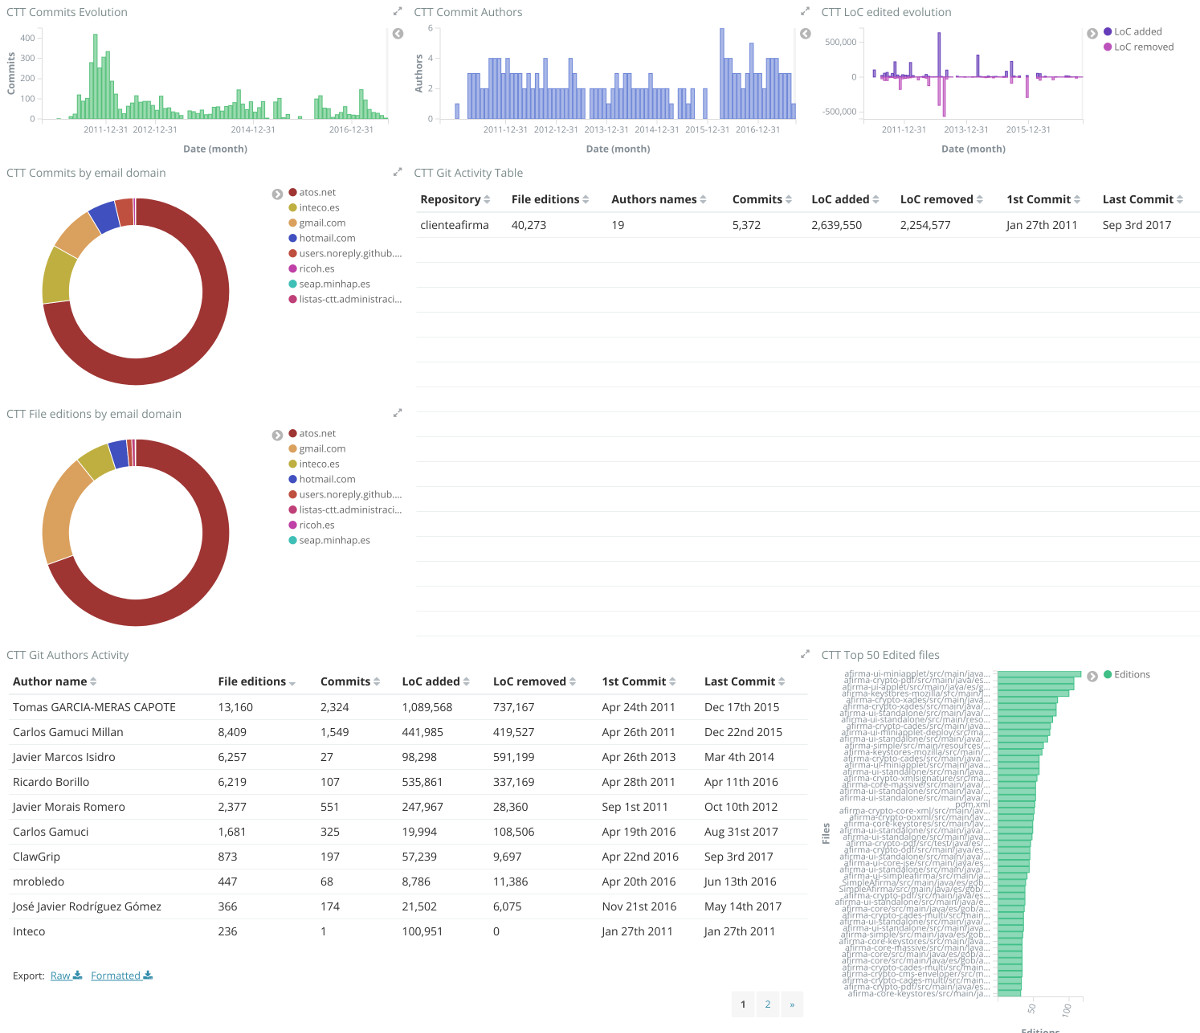
In the other side, we have clientefirma, with almost 7 years of history. It seems that ATOS is one of the main contributors to this project, with some participation from INTECO and RICOH among others.
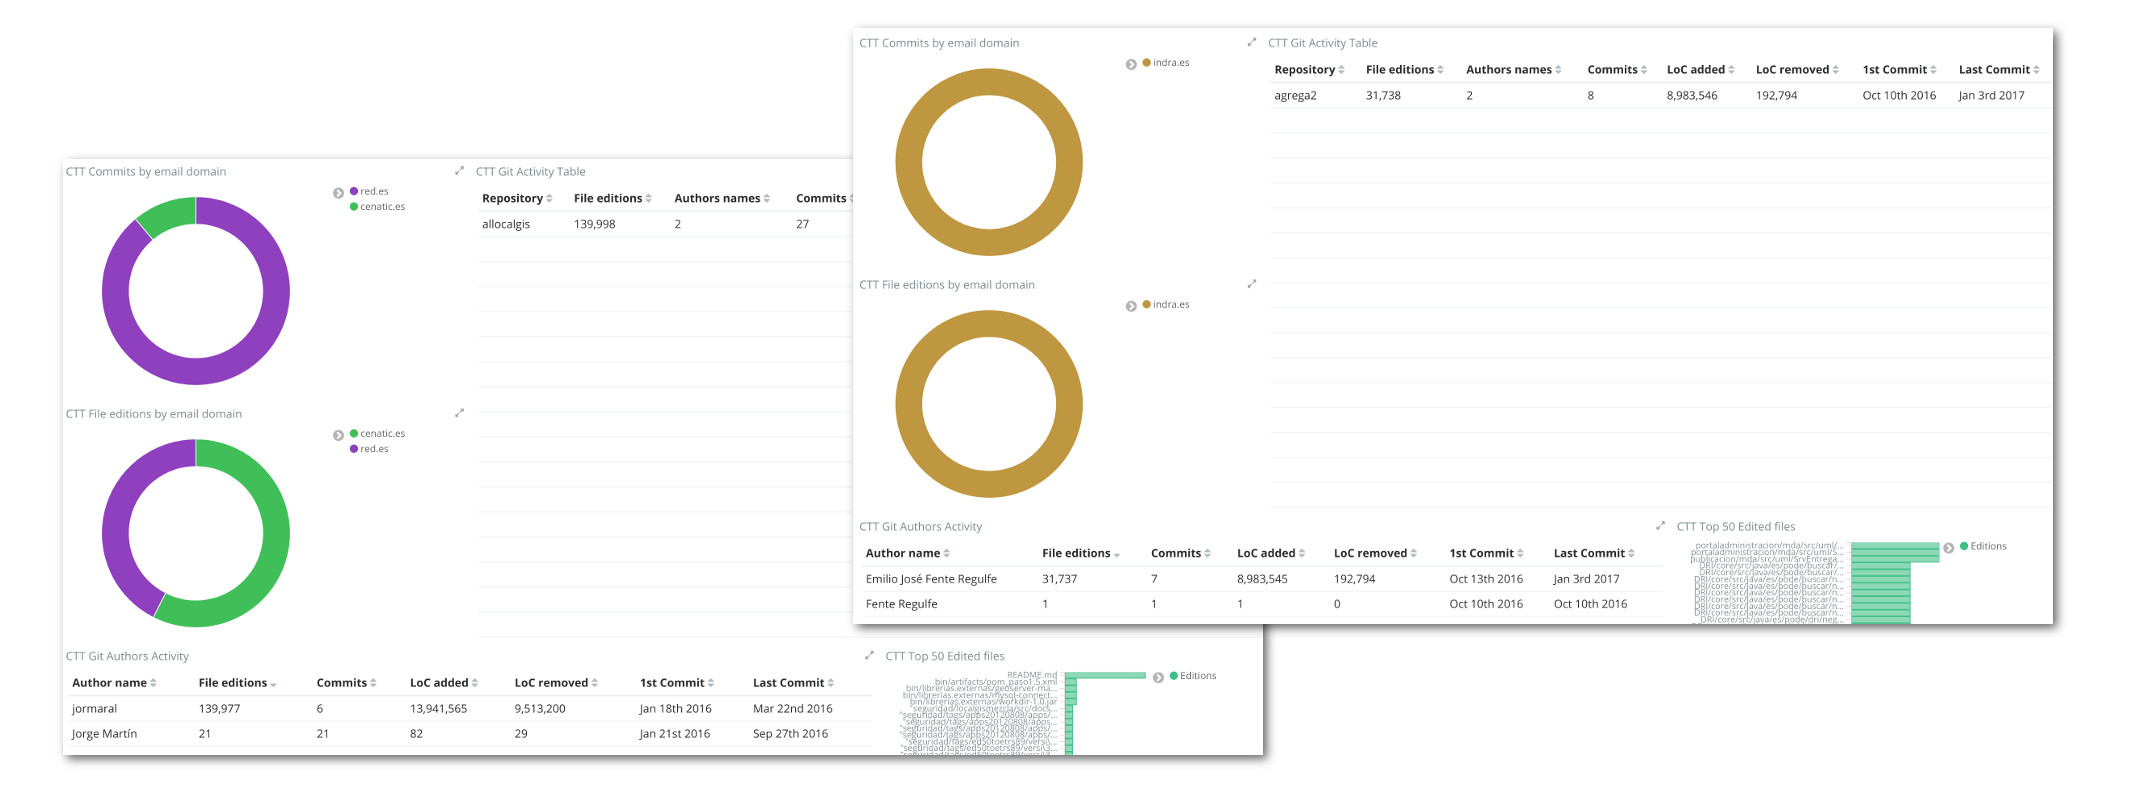
Another interesting projects are allocalgis and agrega2, with significant activity over time, but from just one person each one: Jorge Martin (that worked from CENATIC, now part of Red.es) and Emilio José Fente Regulfe (that seems to work for Indra) respectively.
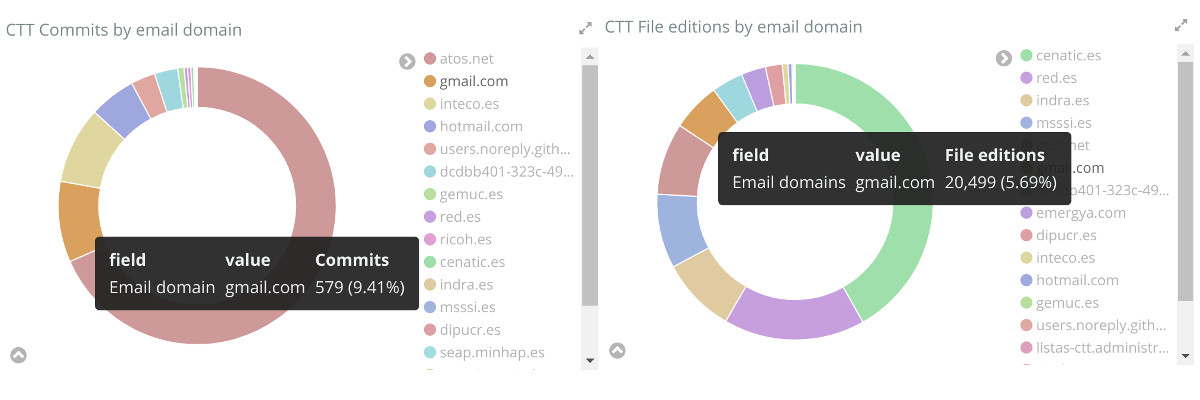
One think that is clear by looking at the charts is the lack of external or public community engagement. How you can see it?
Let’s define the “GMail Ratio” as the % of activity coming from people using their GMail account to contribute. Projects with a lot of public community have around GMail Ratio: 70%. For the projects analyzed aggregated, it’s less than 10%. That usually means that some contributions are not coming from external (public) contributors but contributors that are using both their GMail and their corporate accounts for committing.
I don’t plan to give any further conclusions but showing how easily any GitHub organization repositories can be analyzed with GrimoireLab technology. It’s also an example of how this type of analysis can show facts about how some software projects are being developed.
During following weeks, I’ll be posting how I ran the analysis, so you’ll be able to play by yourself with some basic GrimoireLab tools.
What do you think?
Which other analysis would you like to see or discuss about?
2 Replies to “Analyzing Open Source development in public administrations (part 0)”